
Challenge: According to the impedance characteristics of the human body, the pulse signal of the human body is measured by picking up the impedance change. The LabVIEW powerful digital signal processing function is used to restore the pulse waveform and extract and store the characteristic information of the waveform. After collecting enough data, the mathematical program library of the language and the numerical analysis calculation function are mainly used for regression analysis, and relevant mathematical models are established to reveal the relationship between pulse signal and cardiovascular diseases.
Application: Using NI LabVIEW 8.5 as a software development platform, combined with a pulse signal acquisition device designed by ourselves, a pulse signal measurement system with signal analysis, processing, display and regression analysis of data was developed.
Products used: LabVIEW 8.5 Student Edition
IntroductionWorldwide, the number of patients with cardiovascular diseases has increased day by day and has become the number one killer of human health. The American Heart Association reports that approximately 2.4 million Americans die each year from cardiovascular disease, with the highest proportion of people with hypertension, the most common. The Chinese Ministry of Health has announced that there are more than 150 million people with cardiovascular disease in China. Cardiovascular disease is the leading cause of death in the Chinese population. Therefore, prevention of the occurrence of such diseases is particularly important.
The human body pulse system is an important part of the cardiovascular system. The physiological and pathological information of the human body is extracted from the pulse wave as the basis for clinical diagnosis and treatment. It is valued by the Chinese and foreign medical circles. The shape, intensity and rate of the pulse wave are presented. Comprehensive information on rhythm and other aspects largely reflects the blood flow characteristics of many physiological and pathological processes in the human cardiovascular system. The diagnosis theory of traditional Chinese medicine believes that the transmission of pulse wave is closely related to the blood movement of the cardiovascular system and the law of blood vessel wall movement.
Pulse signal formation mechanismThe blood flows back and forth in a certain direction in the cardiovascular system of the circulatory system. It is called blood circulation. Its source of power is the heart and the heart. The heart is continuously injected from the heart into the artery by doing orderly contraction and relaxation. Each time the contraction occurs, the intra-arterial pressure undergoes a periodic fluctuation. This periodic pressure change causes the arterial blood vessels to fluctuate, called the pulse. The pulse can travel along the arterial wall to the peripheral blood vessels. This spatially propagating fluctuation is called a pulse wave.
Impedance measurement principleBioelectrical impedance measurement, or simply impedance technology, is a detection technique that extracts biomedical information related to human physiological and pathological conditions by utilizing the electrical characteristics and changes of biological tissues and organs. It usually sends a tiny AC measurement current or voltage to the test object by means of an electrode system placed on the body surface, detects the corresponding electrical impedance and its changes, and then obtains relevant physiological and pathological information according to different application purposes.
The part to be examined (this design is an arm) is equivalent to a cylindrical uniform conductor as shown in Figure 1, with the blood vessel in its center.
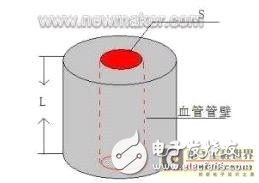
Figure 1 Simplified model of human tissue and blood vessels
According to the physics definition, the resistance R of a conductor depends on the resistivity, length and cross-sectional area of ​​the conductor.
R = ÏL/S= ÏL2 /V
Where Ï is the resistivity; S is the conductor cross-sectional area; L is the conductor length; and V is the conductor volume. Assuming that the length of the cylindrical conductor is constant, the relationship between the derived resistance change ΔR and the volume change ΔV is:
ΔR = - ÏL2ΔV/V2 = - RΔV/V
The above formula shows that the change of volume is closely related to the change of resistance. The negative sign indicates that the increase of volume will lead to the decrease of resistance. That is to say, the part to be inspected by the human body is equivalent to a resistance whose resistance changes periodically, as long as the resistance is measured. The pulse waveform can be measured by the varying waveform. The excitation current is input to the human body, and the impedance of the human body is converted into a voltage signal. The periodic change of the voltage signal can be measured to reflect the change of the impedance, and finally the pulse signal is measured.
Pulse signal acquisition designThe pulse signal has the same characteristics as other bioelectric signals, and the signal is weak, the frequency is low, and it is highly susceptible to interference. Assuming that the equivalent resistance of the human body is 1000 ohms, the impedance change is about 1 ohm with the transmission of the pulse wave, and the magnitude of the change is different from the detection position, individual difference, and electrode system. For large relationships, it is difficult to measure this signal directly. For the human body, the generated electrical signal is not only the pulse signal, but also interferes with other bioelectrical signals with similar frequency and amplitude characteristics. At the same time, the power signal from the outside, the interference from the fluorescent lamp, etc. High quality extraction has a big impact.
The application of virtual instrument technology to analyze bioelectrical signals can effectively reduce the complexity and difficulty of signal processing, and can solve the above problems well, making the processing and analysis of physiological signals more convenient and simple. In view of LabVIEW's powerful digital signal processing and mathematical analysis functions, in order to save development time and improve development efficiency, LabVIEW is used to write software applications to develop a pulse signal detection and analysis system based on LabVIEW.
The pulse signal extraction is based on the principle of modulation and demodulation. The overall block diagram of the system is shown in Figure 2. In this design, the measurement position is the arm. The excitation electrode (E1, E4) is used to input the carrier of 100KHz and 0.6mA to the human body, and the distance between E1 and E4. When set to 15cm, under the excitation of this high-frequency signal, the equivalent impedance of the human body is about 200 ohms. At this time, the human body pulse signal is modulated in the excitation signal, and the output signal is an amplitude modulation wave. The oscillation frequency of the carrier signal is a high frequency signal relative to the pulse signal, and the amplitude modulation wave is input to the pulse through the measurement electrode (E2, E3). The signal conditioning circuit performs analog demodulation and filters out the high frequency carrier to obtain a pulse wave. At the same time, the sampling points before the analog demodulation in the conditioning circuit are sampled at high speed, communicated with LabVIEW through the serial port, and the software is used to demodulate the signal, signal processing, feature value extraction, waveform display, regression analysis and the like.
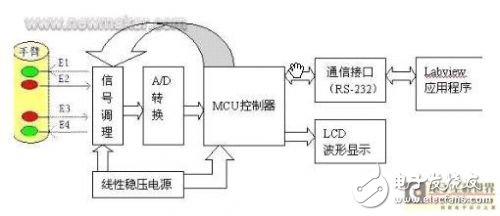
Figure 2 system overall block diagram
LabVIEW programmingIn order to effectively eliminate external interference, reduce the signal distortion caused by analog circuit processing signals, reproduce the true pulse signal as much as possible, and then study various factors affecting the human body pulse signal, apply the LabVIEW virtual instrument development software application, and the application passes The serial port communicates with the hardware, and considering the interference of the computer is large, the optocoupler 6N137 is used to isolate the ground of the computer from the ground of the single chip microcomputer, to prevent the noise coupling signal conditioning circuit on the computer ground line, reduce the noise of the analog circuit, and improve the whole The anti-jamming performance of the system.
The system sets up a personal information entry module and archives the information (age, gender, weight, height, whether it is a hypertensive patient, blood pressure value), and the interface is shown in Figure 3.
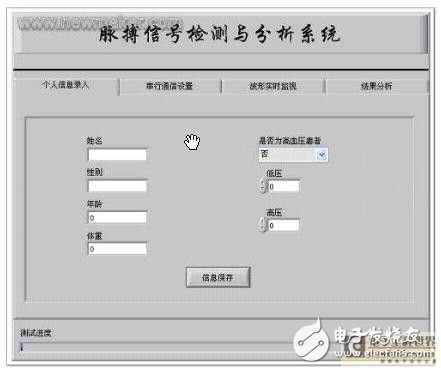
Figure 3 personal information entry module interface
Through the data received by the serial port, the amplitude modulation wave is synchronously demodulated, and the maximum flat-type Butterworth filter is used for filtering the reduced waveform as far as possible without distortion, and the waveform characteristic information is extracted by using peak detection and differential processing. The waveform real-time display module is used for display. The module interface is shown in Figure 4. The module can also display the heart rate, and when the heart rate is not in the normal range, the alarm prompts, and the waveform data can be selected for subsequent processing analysis. Fluctuations in the human emotions or small movements on the limbs will have a greater impact on the signal, and the measurement will be more accurate after the person to be tested has entered the state of mind and body.
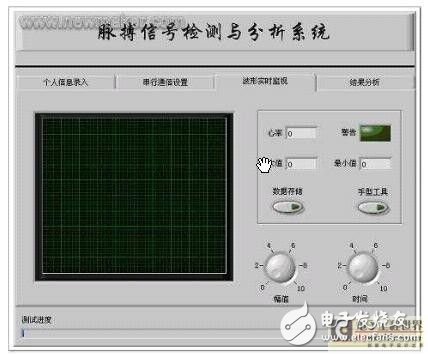
Figure 4 waveform real-time display module interface
LabVIEW's math library and signal processing library provide a variety of mathematical processing and signal analysis tools (Figure 5), which can perform complex numerical analysis, mathematical calculations and signal processing functions. Users can customize various complex algorithms. The traditional instruments do not have such characteristics, the pertinence is not strong, and the cycle and cost of developing the traditional instruments are relatively high. The virtual instruments can be customized to solve the above problems.
Regression analysis is a mathematical tool for dealing with the correlation between variables. It can help people to analyze the relationship between variables from a set of experimental data, and then establish the regression equation between these variables. The ultimate goal of the system application is to conduct human trials. When collecting data to a certain number, in the result analysis module (Figure 6), you can select independent variables, dependent variables (main wave intensity, re-pulse intensity, main wave and re-pulsation). Wave intensity ratio, rising edge slope) and the number of independent variables. In this design, the test data is first read in, and the abnormal data is eliminated by the “Delete beyond interval†tool in the math library. The “Curve Fitting†panel can be configured as needed to display the fitted curve and give the regression coefficient. Regression equation. After accumulating a certain amount of data, summarize the influence of various factors on the pulse signal, study the waveform difference between normal people and hypertensive patients, and the waveform evolution of hypertensive patients with different degrees of disease.
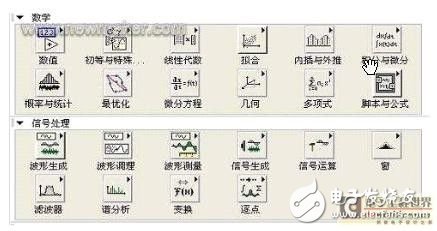
Figure 5 Math and Signal Processing Library
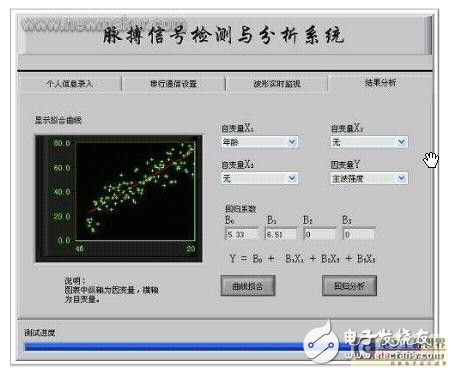
Figure 6 results analysis module interface
System workflowTo use the system for pulse signal measurement, the following steps are required:
1. Select the measurement position and wear the electrode.
2. Enter your personal information and configure the serial port.
3. Start the power supply, the testee should try to keep still, and the data can be operated after the waveform is stable.
in conclusionBased on the pulse signal acquisition device designed by ourselves, the virtual instrument is used as the development platform. The platform has the characteristics of being self-definable, simple and intuitive to program, and easy to understand. And LabVIEW is dedicated to data acquisition, instrument control, signal analysis and data processing tasks, providing a rich and complete function icon, users only need to directly call, interface processing, no need to write a lot of code, greatly saving development time, Reduce development and maintenance costs. The application of this platform has developed a complete and reliable detection and analysis software, successfully realized the pulse signal extraction and display, and has the functions of regression analysis, etc., which provides a good foundation for the subsequent research and teaching work.
The application of the system is a long-term process. The summary of the underlying law is based on a large number of human experiments. Accurate model establishment requires obtaining enough data. This is a long-term and arduous task. Through practice, there will be more functions that need to be added or improved to further improve the performance of the entire system.
Conecting Terminals Without Screws
Conecting Terminals Without Screws,Cold Pressing Terminals,Low Pressure Cold Shrinkage Terminal,Cold Shrinkage Cable Terminals
Taixing Longyi Terminals Co.,Ltd. , https://www.longyicopperlugs.com