
A spectrum analyzer is an instrument that studies the spectral structure of an electrical signal. It is used to measure signal distortion, modulation, spectral purity, frequency stability, and intermodulation distortion. It can be used to measure certain circuits such as amplifiers and filters. The parameter is a versatile electronic measuring instrument. It can also be called a frequency domain oscilloscope, a tracking oscilloscope, an analytical oscilloscope, a harmonic analyzer, a frequency characteristic analyzer or a Fourier analyzer. Modern spectrum analyzers can display analysis results in an analog or digital manner, and can analyze electrical signals in all radio frequency bands from very low frequency to sub-millimeter band below 1 Hz. If the digital circuit and the microprocessor are used inside the instrument, it has the function of storage and calculation; when the standard interface is configured, it is easy to form an automatic test system.
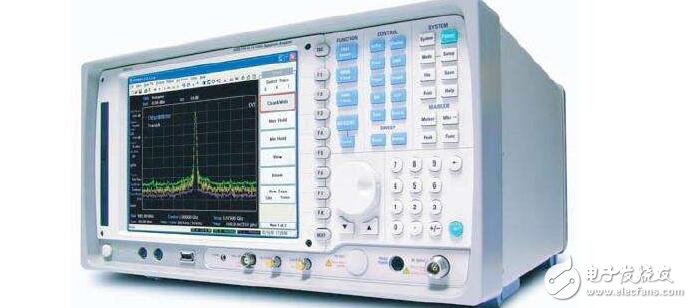
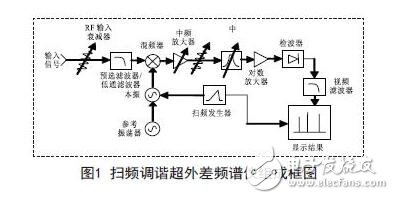
Figure 1 shows the block diagram of the swept-tuned superheterodyne spectrum analyzer. The input signal is passed through an attenuator to limit the signal amplitude, the unwanted frequency is filtered through the low-pass input filter, and then the mixer is mixed with a local oscillator (LO) signal to convert the input signal to an intermediate frequency (IF). The frequency of the LO is controlled by the sweep generator. As the LO frequency changes, the output signal of the mixer (which includes the two original signals, their sum, difference, and harmonics) is filtered by the resolution bandwidth filter to extract the intermediate frequency of the local oscillator higher than the input signal, and The logarithmic scale is amplified or compressed. The signal passing through the IF filter is then rectified by a detector to obtain a DC voltage that drives the vertical portion of the display. As the sweep generator sweeps over a range of frequencies, a trace is drawn on the screen. This trace shows the frequency components of the input signal over the displayed frequency range.
Input attenuators: Ensure that the analyzer maintains good matching characteristics over a wide frequency range to reduce mismatch errors; protects mixers and other IF processing circuits from component damage and excessive nonlinear distortion.
Mixer: Completes the spectrum shift of the signal and transforms the input signals of different frequencies to the corresponding intermediate frequency. In the low frequency band ("3GHz"), high-mixing and low-pass filters are used to suppress image interference; in the high frequency band ("3GHz"), band-pass tracking filters are used to suppress image interference.
Local oscillator (LO): It is a voltage controlled oscillator whose frequency is controlled by a sweep generator. Its frequency stability is phase locked to the reference source.
Sweep Generator: In addition to controlling the local oscillator frequency, it also controls the horizontal deflection display. The sawtooth sweep scans the signal from left to right on the analyzer screen and repeats the scan to continuously update the trace. The span width (Span) is the frequency difference from the left fstart to the right fstop10 grid, for example: Span=1MHz, then 100kHz/div.
IF amplifier: The gain and attenuator setting values ​​work in tandem. When the input attenuation is 10dB, the IF gain is increased by 10dB at the same time, so that the input signal level remains unchanged. The top line reference level of the screen indirectly sets the IF gain value. When the reference level ↑ (or ↓) is 10 dB, the gain ↓ (or ↑) causes the signal to be shifted (or shifted) by 10 dB, ie, the signal display position is changed, but the signal amplitude remains unchanged. When the input attenuation is increased by 10dB, the signal-to-noise ratio is reduced by 10dB. This is because the input attenuation is only attenuated before the mixer, and the noise is generated after mixing, to ensure the input signal level is unchanged. The mixed signal should be amplified by 10dB accordingly, so that the noise is amplified accordingly, that is, the noise level is increased by 10dB.
IF filter: Also known as the resolution bandwidth filter, used to resolve signals at different frequencies. It only allows the local oscillator signal minus the input signal's difference frequency to be equal to the intermediate frequency before it can pass the IF filter and finally display on the screen. Other interfering signals will be suppressed.
The 3dB bandwidth of the IF filter is also known as the resolution bandwidth (RBW). The reason why the signal on the spectrum analyzer cannot be displayed as a wireless thin line, but has a certain width, because when tuning the signal, its shape is the display of the spectrum analyzer's own resolution bandwidth (IF filter) shape. When the RBW is changed, the width of the display response is changed.
The smaller the RBW, the higher the frequency resolution. When the RBW is reduced by a factor of 10, the noise energy reduced by 10 times reaches the detector, and the average noise level displayed is reduced by 10 dB, and vice versa. Noise level change ΔdB=10log(RBWnew/RBWold)=10log(1kHz/10kHz)=-10dB.
Detector: It converts the input signal power into an output video voltage that corresponds to the input signal power. When the spectrum analyzer sweep width Span=0, the envelope detector will demodulate the input signal as a receiver operating in the center frequency (CF) with bandwidth RBW (time domain mode), displaying the signal envelope waveform .
Video Filter: It is a smooth noise display.
It performs a low-pass filter averaging process on the detector output video signal for smooth display. Reducing the video bandwidth (VBW) smoothes the noise jitter in the spectrum display, reducing the range of display jitter. This advantageously allows the spectrum analyzer to detect low-power continuous wave (CW) signals that are submerged in noise and also improve measurement repeatability.
Display: Equivalent to the speaker in the AM radio. The amplitude of each frequency we see is exactly the amplitude of each frequency we hear when tuning the AM radio. The signal is displayed as a rotation vector in the frequency domain. The length of the vector = the peak amplitude of the sine wave. The vector is in it. Position on the frequency axis = signal frequency.
AM signal measurement analysisThe characteristic of the amplitude modulation wave is that the envelope of the carrier amplitude changes with the modulation signal, and the carrier frequency fC does not change. The amplitude modulation signal is expressed by the following equation as U(t)=AC[1+macos(2Ï€FMt)]
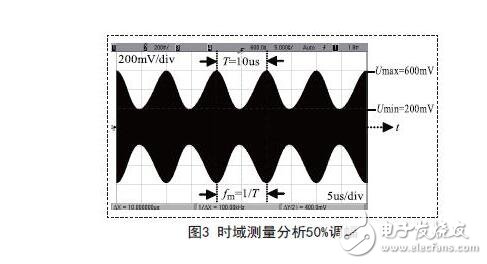
Cos(2πfct)(4-1). Where Ac = constant that determines the total signal amplitude; ma = amplitude modulation depth (0 ≤ ma ≤ 1); cos (2πfmt) = normalized modulation signal, fm = modulation frequency; AC [1 + macos (2πfmt)] determines the carrier The magnitude of the envelope. Fc = carrier frequency. In the time domain, the waveform of a carrier with sinusoidal amplitude modulation is shown in FIG. The signal envelope change is the modulated signal, so the analysis of the envelope waveform can reflect the amplitude modulation parameters. The minimum and maximum values ​​of the waveform envelope are called Umin and Umax.
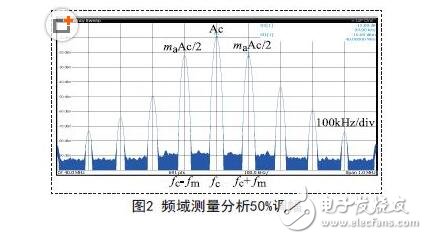
The amplitude modulation coefficient ma can be calculated from these two parameters. When the modulated sine wave is at its maximum positive and negative values, ie ±1, the maximum envelope voltage Umax=1+ma will appear; and the minimum envelope voltage Umin=1-ma. Find the amplitude modulation coefficient ma=(Umax-Umin ) / (Umax + Umin) (4-2), or ma = (1-Umin / Umax) / (1 + Umin / Umax) (4-3). Equation (4-1) is developed to obtain U(t)=ACCos(2πfct)+maAc/2[cos2π(fc+fm)t+cos2π(fc-fm)t](4-4). It can be seen that in the frequency domain, the amplitude modulated signal U(t) consists of a carrier of amplitude Ac and two sidebands; one at fc+fm and the other at fc-fm, both of which have a magnitude of maAc /2, the spectrum is shown in Figure 2. The modulation frequency fm is the frequency difference between the carrier and one of the sidebands (the sidebands are symmetric with respect to the carrier). The amplitude difference corresponds to the amplitude modulation coefficient ma. That is, the sideband amplitude relative to the carrier is expressed in dB as dBc=20log(ma/2), then ma=2&TImes; 10dBc/20.
A spectrum analyzer can be used to characterize an amplitude modulated signal in the frequency and time domains. The parameters that can be measured are carrier amplitude and frequency, modulation frequency, and amplitude modulation factor.
Set the signal source output carrier frequency fc=400MHz, carrier amplitude 0dBm; modulation frequency fm=100kHz (period T=10us), amplitude modulation coefficient ma=50%. Connect the signal source output to the spectrum analyzer input measurement amplitude modulation signal. The spectrum analyzer settings are as follows:
(1) Press [Reset]; (2) [Frequency], [Center Frequency], 400 [MHz]; (3) [Amplitude], [Reference Level], 0 [dBm]; (4) [Sweep Width 】, [bandwidth], 1 [ MH z ]; the frequency domain characteristics of the amplitude modulation signal are (5) [peak search], identification carrier signal; (6) [frequency standard], [Δ frequency standard], moving the identification to modulation At the sideband frequency position, the frequency difference Δf = fm = 1 0 0 k H z, the amplitude difference of the sideband relative to the carrier dBc = -12.04 dB, and the amplitude modulation coefficient ma = 2 & TImes; 10 dBc / 20 = 2&TImes;10-12.04/20=50%. The time domain characteristic of the amplitude modulation signal is (7) Press [Sweep Width], [Bandwidth: Zero Bandwidth]; (8) [Bandwidth], [RBW: Manual], 3 [MHz]; [VBW: Manual], 3[MHz]; (9) [Amplitude], [Linear], [Reference Level], [↑][↓]; Adjust the reference level so that the signal is at the center of the display. (10) [Scan], [Scan time:
Manual], 1 0 0 [ us ]; ( 1 1 ) [Trigger], [Video], [↑][↓] Adjust the trigger level to make the signal display stably. (12) [Frequency Standard], [Conventional Frequency Standard], measure the envelope peak value, [Δ frequency standard] to turn on the relative measurement, and measure the envelope peak-to-peak value. Move the marker to the adjacent peak-to-peak value to measure the modulation signal period T=10us, then fm= 1 / T = 1 0 0 k H z. Move the marker to the adjacent peak-minimum value to measure The linear amplitude ratio Umin/Umax=0.333, which can be obtained by substituting (4-3) for the amplitude modulation coefficient ma=(1-0.333)/(1+0.333)=1/2=50%.
It can also be seen from the time domain amplitude modulation wave in Fig. 3 that the waveform envelope Umax=600mV, Umim=200mV, and substituting it into (4-2), get ma=(600-200)/(600+200)=1/2 =50%.
The spectrum analyzer can measure the amplitude modulation signal in both frequency domain and time domain. By understanding the working principle of the spectrum analyzer and measuring signal analysis, the spectrum analyzer can be correctly understood, used, operated and applied. Due to space limitations, only the amplitude modulation signal is measured and analyzed. The spectrum analyzer can also measure the frequency, power, bandwidth, modulation and other parameters of harmonic distortion, third-order intermodulation, excitation response, phase noise and other types of signals. analysis.
How to use the spectrum analyzer:(1) The measurement range of the AT5010 spectrum analyzer is: -100dBm--+13dBm, that is, when the signal intensity reaches the highest horizontal scale line, the amplitude of this signal is -27dBm, and the next large grid is reduced by 10dBm. If the 40dB attenuator on the spectrum analyzer is fully pressed, the highest horizontal scale line amplitude is +13dBm (-27dBm + 40dBm).
(2) Some signal test points of the mobile phone can be directly connected to the spectrum analyzer with high frequency cable for measurement. However, some test points cannot be directly measured because of the impedance matching problem. Antai AZ530-H high-impedance probe can be used. The input capacitance of the probe is 2pF. The impedance is extremely high. It can directly measure any RF signal on the mobile phone. The circuit has any effect. The AZ530-H high-impedance probe itself has a 20dB (typ) attenuation, so when used for quantitative measurements, add 20dB to its direct reading.
(1) Turn on the spectrum analyzer and adjust the brightness and focus knob to make the traces displayed on the screen clear.
(2) Adjust the sweep width selection button (SCANWIDTH) button to make the 1MHz indicator light, indicating that the frequency occupied by each grid is 1MHz.
(3) Adjust the center frequency coarse/fine adjustment knob so that the frequency scale is at the center of the screen, and the indicated frequency is 6MHz.
(4) Connect the spectrum analyzer probe housing to the grounding point of the T18 circuit board. The probe is inserted into the output of the second IF filter. When the ammeter pointer is swung, observe whether there is a pulse image on the spectrum analyzer screen. Under normal circumstances, when When the ammeter pointer swings, a pulse image appears at the 6MHz frequency marker position.
For another example, to measure the spectrum of the Nuoji 3310 power amplifier output signal with a spectrum analyzer, the measurement can be performed as follows.(1) Turn on the spectrum analyzer and adjust the brightness and focus knob to display a clear image on the screen.
(2) Adjust the center frequency coarse/fine adjustment knob so that the frequency scale is at the center of the screen, and the display shows the frequency value as 900MHz.
(3) Adjust the sweep width selection button (SCANWIDTH) button to make the 10MHz indicator light, indicating that the frequency occupied by each grid is 10MHz.
(4) Connect the spectrum analyzer housing to the 3310 motherboard grounding point, insert the control pin into the output end of the power amplifier block, and dial “112†to observe the current meter swing while watching the spectrum image on the spectrum analyzer screen. Under normal circumstances, A pulse image will appear near the 900MHz frequency scale, but the amplitude will exceed the screen range. You can press the fade button to make the highest point of the image within the screen range.
(5) Marker button (ONOFF): When the marker button is placed in the OFF position, the center frequency (CF) indicator lights up, and the display reads the center frequency. When the switch is in the ON position. When the marker (MK) indicator is lit, the display reads the frequency of the marker, which is a spike on the screen.
(6) Marker knob (MARKER): used to adjust the marker frequency.
(7) LED indicator light: When flashing, the amplitude value is incorrect. This is due to the reduced amplitude of the sweep width and the improper setting of the IF filter. This situation may occur when the sweep range is too large (relative to the IF bandwidth (20 kHz), or the video filter bandwidth (4 kHz)). For correct measurement, the video filter may not be used or the sweep width may be reduced.
Ms001 3000Puffs Vape,Mini Electronic Cigarette,Vape Electric Cigarette,Electronic Cigarette Vape Puff Bar
Guangzhou Yunge Tianhong Electronic Technology Co., Ltd , https://www.e-cigarettesfactory.com